This article was originally published in the Elevate Your Marketing newsletter and has been repurposed and republished here with the author’s permission. Here is the link to the original article.
Let me start with this disclaimer.
This is a very vast topic!
I could probably write a book on all the metrics you can (and you should) measure to evaluate the performance of your B2B marketing function. Given this, I will be looking at this through the lens of one of the main objectives of any B2B marketing team, which is:
To generate new business (which is expressed as leads, MQLs, pipeline, ACV, etc).
The metrics defined with this goal in mind can be used for a review meeting with your CMO, CEO, or management team to get an outcome-based view of how marketing has fared during a defined period.
That said, let us dig right in.
How to define B2B marketing metrics
In this section, we will dive deep into the key metrics you need to measure to understand marketing’s impact on the business’s topline. To do that, we need to first understand what a marketing funnel is.
What is a B2B marketing funnel?
We are going to be looking at the metrics at different levels of the B2B marketing/sales funnel. A marketing or sales funnel is nothing but the journey or the different stages a prospect goes through before eventually converting into a customer (sometimes a funnel represents a journey beyond conversion as well – such as retention, loyalty, etc).
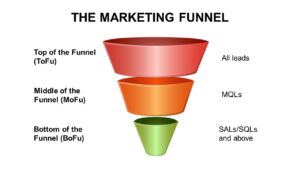
Though there could be differences in the marketing funnel depending on the nature of your business, here is what a typical funnel would look like:

The bottom of the funnel is where you have the later stages in the journey such as SALs (Sales Accepted Leads), SQLs (Sales Qualified Leads), opportunities, and deal wins.
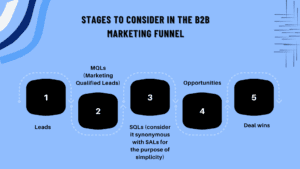
Based on this funnel, the stages we will be considering to define the metrics are:

Stages of the B2B marketing funnel
- Leads
- MQLs (Marketing Qualified Leads)
- SQLs (you can consider it synonymous with SALs for simplicity)
- Opportunities
- Deal wins
B2B marketing metrics at the leads stage
The leads stage is the top of your funnel. You take in pretty much everything (every lead) you get. At this stage, the following are the key metrics you need to measure:
- Number of leads
- Intent/propensity to buy (whether the lead is hot/warm/cold)
- Time/urgency of the need
- Cost per lead
Also read: B2B Lead Qualification Methods To Improve Lead Quality
9 Unconventional B2B Lead Generation Techniques
Metrics at the MQL stage
At the MQL stage, the marketing team would have done its job by qualifying the leads further by using a set of firmographic, demographic, and intent-based characteristics (say a query by the lead while filling in the website form). Here you would want to assess the quality of leads using metrics like:
- Number of MQLs
- Intent/propensity to buy (whether the lead is hot/warm/cold)
- Time/urgency of the need
- Average TAT (Turnaround time – time taken by a lead to convert to MQL)
- Cost per MQL
- Lead to MQL conversion (% of leads that converted to an MQL)
B2B marketing metrics at the SQL stage
At the SAL/SQL stage, the metrics are similar to that of the MQL stage, only that you measure them for SQLs. Hence, the metrics are:
- Number of SQLs
- Intent/propensity to buy (whether the lead is hot/warm/cold)
- Time/urgency of the need
- Average TAT (Turnaround time – time taken for an MQL to convert to SQL)
- Cost per SQL
- MQL to SQL conversion (% of MQLs that converted into an SQL)
Metrics at the opportunity stage
At the opportunity stage, all metrics would remain the same as that of the MQL and SQL stages except for one – ACV (Annual Contract Value). Depending on the industry you are in, this can be expressed using terms like subscription value. Sometimes, instead of using the average value for a year, the total deal size is also used.
So, the metrics you need to measure at the opportunity stage are
- Number of opportunities
- Intent/propensity to buy (whether the lead is hot/warm/cold) – in some cases intent might be very clear at this stage. However, the propensity to buy might still be quite uncertain.
- Time/urgency of the need or opportunity
- Average TAT (Turnaround time – time taken for an SQL to convert to opportunity)
- Cost per opportunity
- SQL to opportunity conversion ratio (% of SQLs that converted into an opportunity)
- ACV or deal size
Metrics at the deal win stage
Once you win a deal or customer, you are most interested in:
- The value of the deal or the customer
- The ROI of investing the time and effort in bringing in the customer
Given these, the metrics you need to measure at this stage are:
- Number of deal wins
- Average TAT (turnaround time – time taken for an opportunity to become a deal win)
- Total deal cycle (time taken from the lead generation to deal win)
- Opportunity to deal win conversion (% of opportunities that converted into a deal win)
- ACV/deal size
- LTV (Lifetime value) – this is a derived or estimated metric rather than measured
- CAC (Customer Acquisition Cost) – this is also derived or calculated
LTV and CAC are calculated at the deal win stage more to maintain healthy spending on customer acquisition tactics. Depending on the industry, the recommended LTV to CAC ratio will vary. For B2B SaaS, typically this is a minimum of 3:1.
Dimensions along which B2B marketing metrics have to be measured
At all stages of the marketing funnel, the metrics discussed above can be measured along different dimensions to get a complete view of the effectiveness of your marketing activities across multiple channels, campaigns, teams, etc.
Following are the dimensions you need to consider:
- Source/channel (say leads by source, MQLs by source, etc)
- Region/geo
- Business unit/division
- Marketing manager/demand gen manager (quantity and quality of leads generated by the demand gen manager)
- Campaign
- Period
It is to be noted that it might not make sense to measure all the metrics along every single dimension for two reasons:
- Drilling down too much might throw many null values.
- The sample taken might not be statistically significant and hence it doesn’t make any sense to draw conclusions based on such small volumes of data.
So, make sure you customize the metrics and dimensions according to your business needs and objectives.
That’s all I wanted to cover in this article. Hope you found this piece insightful.
Related: 10 metrics to measure B2B brand awareness and reach
Skalegrow – B2B marketing agency
With marketing getting tougher and tougher, every wrong foot you make might hamper your growth. What you need is the right guidance and a helping hand. This is where Skalegrow can make a sea of difference.
Skalegrow helps IT, tech, SaaS, and embedded systems companies leverage new-age marketing tactics to grow their business. Check out the below intro video to learn more about what Skalegrow brings to the table:
We are already helping some of our clients generate leads and improve brand awareness using innovative marketing techniques. Visit our services page to learn more about how we can help. You could also write to us at info@skalegrow.com.
About the author

Naseef KPO is the Founder and CEO of Skalegrow. He comes with rich experience across multiple areas of B2B marketing including content marketing, demand generation, SEO, account-based marketing, marketing analytics, revenue attribution, marketing technology, etc. He writes thought-provoking and relevant articles on The Skalegrow Blog and his weekly LinkedIn newsletter Elevate Your Marketing.
Prior to starting Skalegrow, Naseef led large marketing teams in multi-million dollar B2B organizations where he made significant contributions to the topline growth of the business. He has also appeared on numerous podcasts where he shared his thoughts on trending marketing topics such as the application of AI in marketing, startup marketing, ABM, and B2B content marketing, just to name a few. Being the founder of Skalegrow, he is currently focusing on helping its clients stay ahead of their competition by using innovative yet practical marketing tactics.
You can connect with Naseef KPO on LinkedIn.


